Next.js wasn't built for a fire-hose. So I moved the data path to Go.
FLARE delivers low-latency market data, orderbooks, candlesticks and time-and-sales to trading-floor users. The initial version routed real-time data through Next.js API routes. It worked until volume hit production levels — then the single-threaded Node.js event loop got starved by the constant message firehose, blocking everything else on the server. UI requests timed out. Charts froze.
- Diagnosed: Node's single-threaded model + JSON parse cost on high-frequency feeds = event-loop starvation.
- Moved the entire data path to a Go server (`golang-bullflare-ui-server`) with goroutines + channels for true parallelism.
- Each market data domain — market data, orderbook depth, candlesticks, time-and-sales, symbol messages, positions — got its own WebSocket endpoint backed by goroutines reading from ClickHouse.
- Next.js kept what it's good at: rendering the UI and proxying user-facing requests.
- Result: charts stay live under production load and the UI thread never blocks on data work.

Go + ClickHouse + gRPC + a dashboard built for traders.
The Go server (`gorilla/mux`, `gorilla/websocket`, `clickhouse-go/v2`, `golang-jwt`) exposes parallel HTTP + WebSocket endpoints — `/api/marketData/*` and `/api/marketData/*/ws` — backed by ClickHouse for the time-series side. The Next.js frontend (React 19, Turbopack, Zustand, SWR, lightweight-charts + ECharts) consumes those streams and renders a drag-and-drop dashboard (`@dnd-kit`) of resizable panels (`react-resizable-panels`). User-defined filter groups are persisted server-side per user.
“User-defined filter groups are persisted server-side per user.”
- Market data, orderbook depth, candlestick, time-and-sales — each one a typed WebSocket handler in Go.
- ClickHouse for analytical queries; gRPC for downstream service calls; JWT auth in the middleware.
- Frontend: lightweight-charts (TradingView), ECharts, drag-and-drop layouts, saved filter groups, CSV export.

Real-time risk management around an FPGA core.
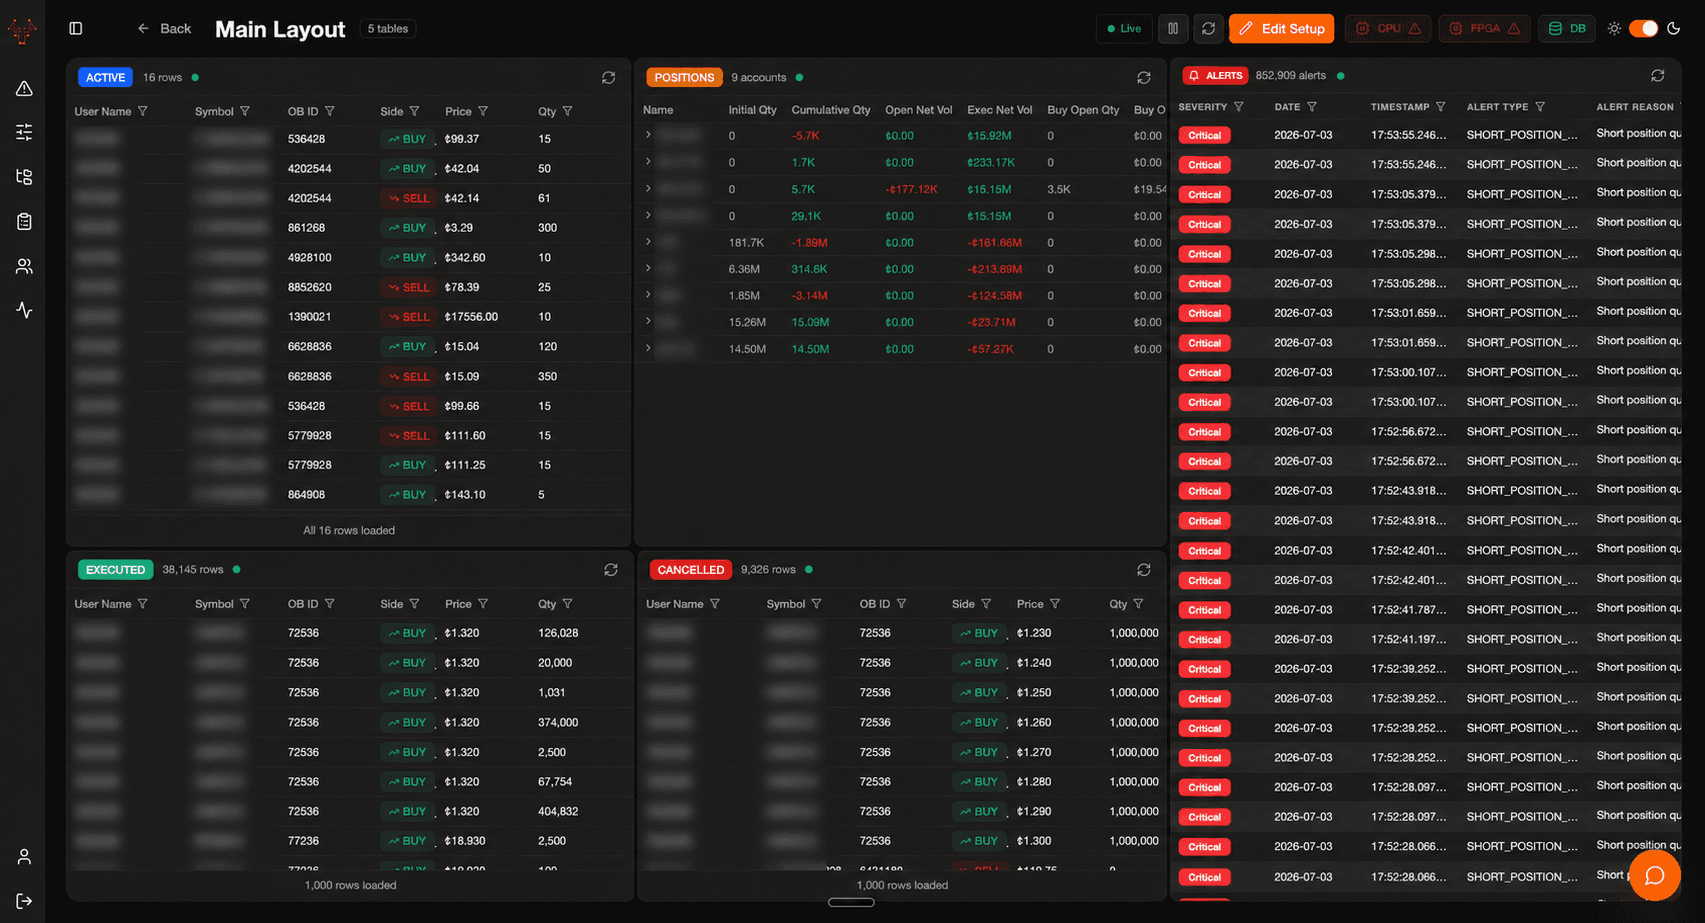
NanoShield is a real-time trading risk management system — a Next.js 16 frontend, a Go backend (HTTP + WebSocket + gRPC), and a PostgreSQL schema with composite types, RLS, and NOTIFY/LISTEN triggers. Writes go through an external gRPC service into Postgres; reads come back direct; real-time updates flow through Postgres triggers → Go broadcasters → a WebSocket hub → SWR cache invalidation in the frontend.
- Six Go broadcasters — alerts, orders, positions, limits, health, activity — each one polling Postgres, hashing for change detection, and pushing through a central WebSocket hub.
- Hybrid SWR + WebSocket pattern: SWR for initial fetch + safety-net polling, WebSocket for instant invalidation.
- Custom JWT auth with refresh-token deduplication (shared-promise pattern) so 50 concurrent 401s only refresh once.
- Two Postgres pools — authDB and shieldDB — so auth tokens never compete with risk-data queries for connections.
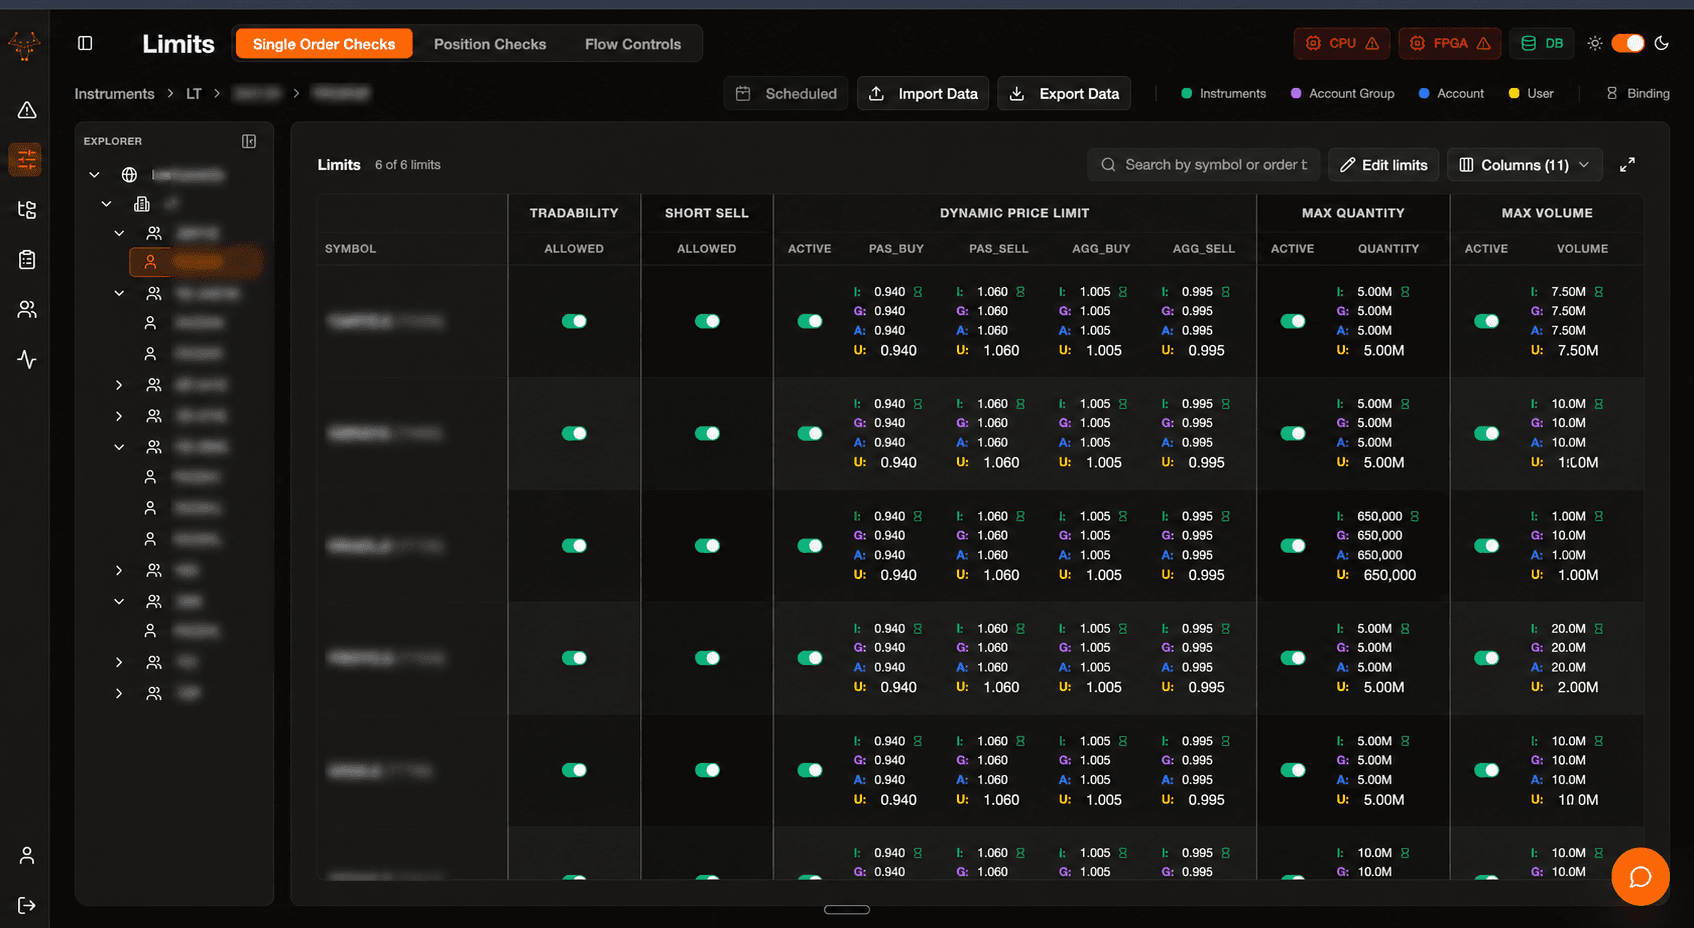
- Entity hierarchy: Instruments → AccountGroup → Account → User, each with their own limit types as PostgreSQL composite columns.
From around a second to ~20 ms.
Risk dashboards are only as real-time as their slowest query. Some of the hot endpoints were taking on the order of a second under production data volumes — fine in a demo, unusable on a trading floor. I profiled the slow paths, read the query plans, and fixed the shape of the problem before reaching for caching: the right indexes, the right filter order, fewer round trips, less over-fetching.
“Risk dashboards are only as real-time as their slowest query.”
- Profiled with `EXPLAIN ANALYZE` against production-scale data, not dev fixtures.
- Added composite indexes matched to the actual filter + sort patterns of the dashboards.
- Cut over-fetching — select only the columns the view needs, paginate the rest.
- Collapsed N+1 patterns into single queries with joins and aggregates.
- Measured before and after on every change — the hot paths went from ~1 s to ~20 ms.

Cross-functional, document-first.
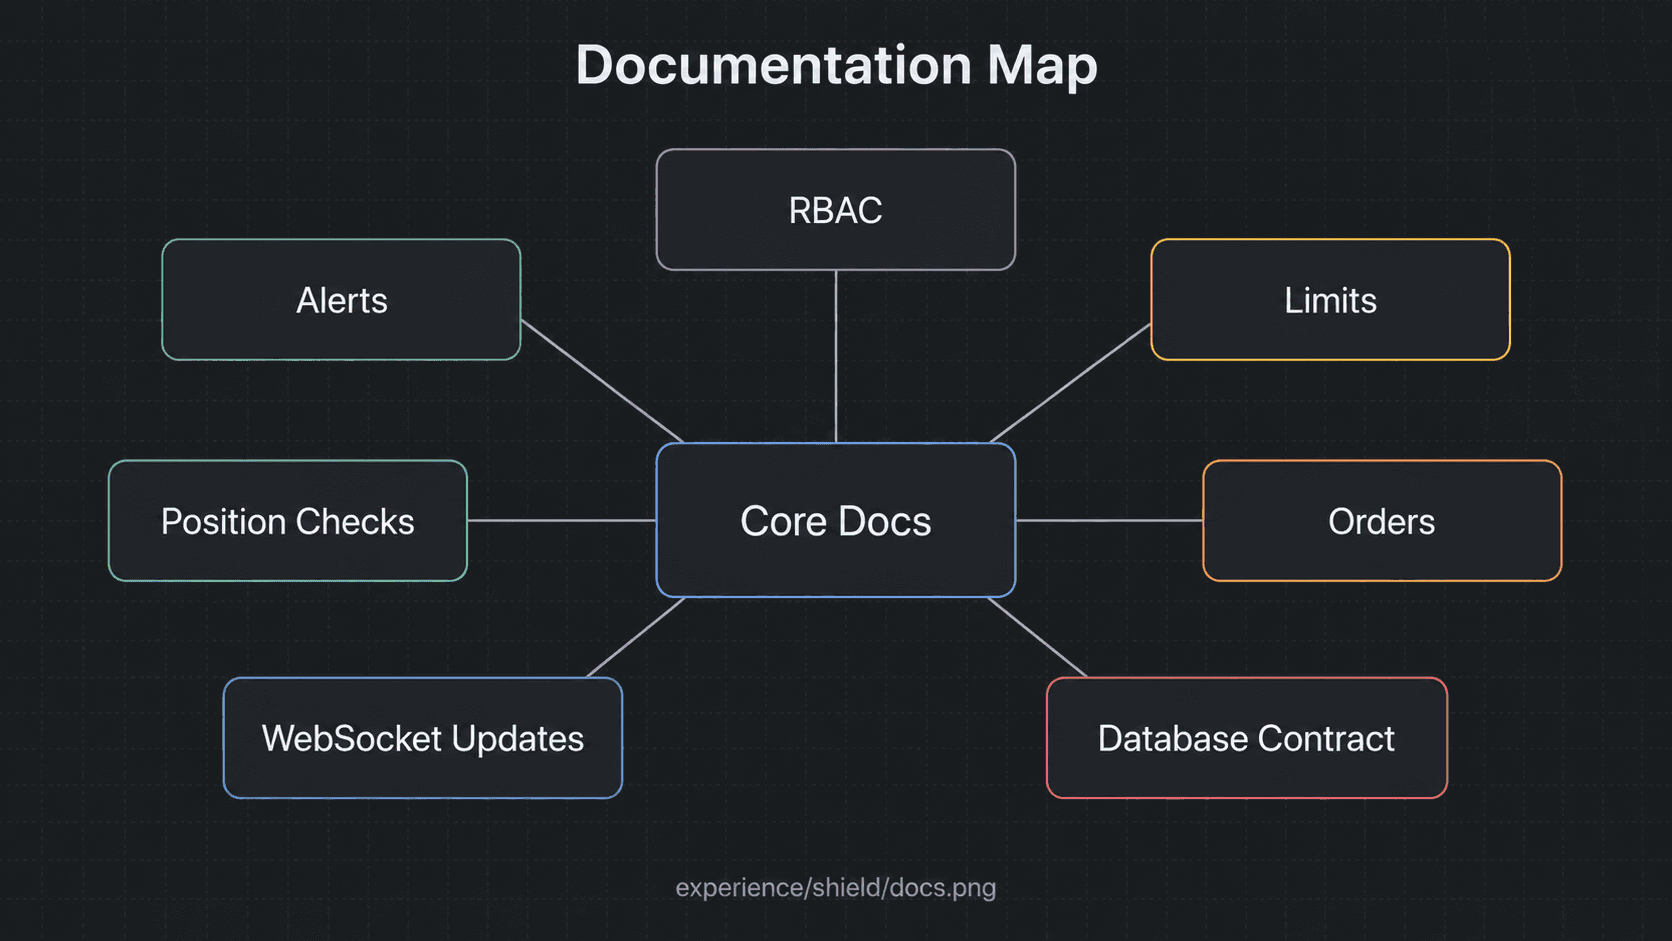
Hardware engineers, quants, and designers all sit at the same table. The product moves fast because we write design docs first — RBAC, alerts architecture, position checks, limits page, performance notes — and code second. Most of my value here is being the person who can talk across all three teams and translate intent into a system contract.
built by one person · case study written by the same person